
Analyzing system crashes on non-persistent machines can be a bit tricky. In this article I use a live example to demonstrate how to find the root cause.
Table of Contents |
Introduction
Recently, I had to analyze an issue in a Citrix Virtual Apps and Desktop (CVAD) farm, version 1808, in Azure. Each day, one or more servers (workers) crashed unexpectedly and the cause for this was unknown.
The high-level configuration of the infrastructure and the workers was as follows:
- Deployment methods: Citrix Machine Creation Services (MCS) version 1808
- Environment/hypervisor: Microsoft Azure
- Workers:
- Operating system: Windows Server 2016 version 1607
- VDA version: 1808.2
To get to the root cause of random server crashes there are three things that you need:
- Get notified of server crashes and determine the computer name(s)
You need to be alerted as soon a server crashes in order to secure the dump file. The dump file is required for further analysis. Also, you need to know the computer name of the server that crashed. - Secure the dump file (*.DMP) for further analysis
Once you know which server(s) crashed, you need to secure the dump file (*.DMP). This file contains the information to determine which process or driver caused the crash. On non-persistent machines, the dump file may be lost during reboot so you need to prepare for this. - Download WinDbg, analyze the dump file and find the root cause
You need a tool to open, read ad interpret the dump file. In this article we will use the standard Microsoft tool Windows Debugger (WinDbg).
1. Get notified of server crashes and determine the computer name of the server(s) that crashed
It is imperative that you get notified of any server crashes immediately. First of all, server crashes have a huge negative impact on users, since these users will most likely lose data due to the unexpected reboot that follows right after the server crashes. Even if no data is lost, the experience of your remote session simply being dropped and all your applications being closed is not a pleasant one.
Secondly, you want to secure the dump file (*.DMP) as soon as the server is back online again. The dump file contains a snapshot of the memory that was in use at the time of the crash. You need this file to find the root cause. We will deal with the dump file in the following section.
In case you are using third-party monitoring software, this software can notify you as soon as a server is not reachable for a certain amount of time. In case you do not have any monitoring software at your disposal, let me share with you a small script I wrote that monitors the connection to your servers. The script is based on my installation template and my PowerShell Functions Library.
In summary, the script pings each worker in an interval of five seconds. Verbose output is written in the console as well as in a separate log file. In case a server is not reachable, an automated e-mail is sent. I recommend that you run this script on a server that does not host user sessions. No Citrix PowerShell modules are required for this script to run.
The functions used in the scripts require my PowerShell Functions Library to be present on the local system. This means that before you can use the script, you need to copy the PowerShell module file DS_PowerShell_Function_Library.psm1 to the local system.
The script was created for Windows 10 (all versions) and Windows Server 2016 (all versions). I tested this script on Windows Server 2016 version 1607.
In order to use this script, please follow these steps:
- Create an installation directory on the server where you want to execute the script. For example: C:\Scripts.
- Download and copy the PowerShell module file DS_PowerShell_Function_Library.psm1 to a directory of your choosing on the server.
- Copy the PowerShell script below to a new PS1 file (e.g. Citrix_CVAD_Check_Connection_Workers.ps1) and add this file to the directory we created previously.
- Modify the PowerShell script:
- Line 45 (optional): modify the location of the log directory.
- Line 46: enter the correct path to the PowerShell module file.
- Line 47: enter the names of the workers you want to monitor.
- Line 48: enter the e-mail address of the sender.
- Line 49: enter the e-mail address of the recipient(s).
- Line 50: enter the subject of the e-mail.
- Line 51: enter the name of the SMTP server.
|
1 2 3 4 5 6 7 8 9 10 11 12 13 14 15 16 17 18 19 20 21 22 23 24 25 26 27 28 29 30 31 32 33 34 35 36 37 38 39 40 41 42 43 44 45 46 47 48 49 50 51 52 53 54 55 56 57 58 59 60 61 62 63 64 65 66 67 68 69 70 71 72 73 74 75 76 77 78 79 80 81 82 83 84 85 86 87 88 89 90 91 92 93 94 95 96 97 98 99 100 101 102 103 104 105 106 107 108 |
#========================================================================== # # CITRIX VIRTUAL APPS AND DESKTOPS (CVAD) - CHECK CONNECTION WORKERS (PING) # # AUTHOR: Dennis Span (https://dennisspan.com) # DATE : 10.01.2019 # # COMMENT: this script checks the general availability of the CVAD workers # # This script has been created for Windows 10 (all versions) and Windows Server 2016 version 1607 and higher # This script has been tested on Windows Server 2016 version 1607 # # Note: see the article 'https://dennisspan.com/powershell-scripting-template-for-sccm-packages/' for a detailed description how to use this template # # Note: for an overview of all functions in the PowerShell function library 'DS_PowerShell_Function_Library.psm1' see: # -Windows functions: https://dennisspan.com/powershell-function-library/powershell-functions-for-windows/ # -Citrix functions: https://dennisspan.com/powershell-function-library/powershell-functions-for-citrix/ # # Change log: # ----------- # <DATE> <NAME>: <CHANGE DESCRIPTION> #========================================================================== # define Error handling # note: do not change these values $global:ErrorActionPreference = "Stop" if($verbose){ $global:VerbosePreference = "Continue" } $ExitCode = 0 ################################## # Preparation (DO NOT DELETE!!!) # ################################## # Disable File Security $env:SEE_MASK_NOZONECHECKS = 1 # Variables [do NOT edit] $SystemDrive = $env:SystemDrive $DateTime = Get-Date -Format yyyy-MM-dd_hh-mm-ss $ScriptName = $MyInvocation.MyCommand.Name $ScriptNameShort = ($MyInvocation.MyCommand.Name).Substring(0,(($MyInvocation.MyCommand.Name).Length)-4) # Custom variables [edit] $LogDir = Join-Path $SystemDrive "Logs" # [edit] Enter the directory where you want the log file to be written $ScriptDir = Join-Path $SystemDrive "Scripts" # [edit] Copy the Dennis Span PowerShell Function Library to this directory (the *.PSM1 file) $Servers = "Worker1","Worker2","Worker3","Worker4","Worker5" # [edit] Enter the (fully qualified) DNS names of the worker servers $From = "ServerCrashReport@mycompany.com" # [edit] Enter the e-mail address from which you would like to send the e-mail. The e-mail address does not need to exist. For example: ServerCrashReport@mycompany.com $To = "firstname.lastname@mycompany.com", "firstname.lastname@mycompany.com" # [edit] Enter one or more e-mail addresses you would like to send the e-mail to. Separate multiple e-mail addresses using a comma, e.g. "<name1>@mycompany.com", "<name2>@mycompany.com" $Subject = "Server crash report (Citrix CVAD)" # [edit] Enter the subject of the e-mail $SMTPSServer = "mysmtpserver.mycompany.com" # [edit] Enter your SMTP server. Enter either the IP address or the DNS name of the server (I recommend to use the fully qualified name, e.g. "mysmtpserver.mycompany.com") # Variables [do NOT edit] $Global:LogFile = Join-Path $LogDir "$($ScriptNameShort)_$($DateTime).log" # Create the log directory if it does not exist if (!(Test-Path $LogDir)) { New-Item -Path $LogDir -ItemType directory | Out-Null } # Create new log file (overwrite existing one) New-Item $LogFile -ItemType "file" -force | Out-Null # Import the Dennis Span PowerShell Function Library Import-Module ( Join-Path $ScriptDir "DS_PowerShell_Function_Library.psm1" ) DS_WriteLog "I" "START SCRIPT - Server Startup Script for Citrix Virtual Apps and Desktop" $LogFile DS_WriteLog "-" "" $LogFile ##################################### # TEST CONNECTION TO WORKERS ##################################### DS_WriteLog "I" "#####################################" $LogFile DS_WriteLog "I" "TEST CONNECTION TO WORKERS" $LogFile DS_WriteLog "I" "#####################################" $LogFile # Reference: https://blogs.technet.microsoft.com/heyscriptingguy/2012/02/24/use-powershell-to-test-connectivity-on-remote-servers/ DS_WriteLog "-" "" $LogFile # Loop through each server and check if it can be reached $i = 0 While($true) { $i++ Foreach ($Server in $Servers) { if (! (Test-Connection -Cn $Server -BufferSize 16 -Count 1 -ea 0 -quiet)) { if(!(Test-Connection -Cn $Server -BufferSize 16 -Count 1 -ea 0 -quiet)) { DS_WriteLog "E" "Loop $($i): Connection to server $($Server.ToUpper()) failed" $LogFile # Send a notification e-mail DS_SendMail -Sender $From -Recipients $To -Subject $Subject -Text "Server $($Server.ToUpper()) crashed. After the reboot, save the dump file!" -SMTPServer $SMTPSServer } else { DS_WriteLog "S" "Loop $($i): Connection to server $($Server.ToUpper()) was successful" $LogFile } } else { DS_WriteLog "S" "Loop $($i): Connection to server $($Server.ToUpper()) was successful" $LogFile } } Start-Sleep -Seconds 5 } ############################ # Finalize # ############################ # Enable File Security Remove-Item env:\SEE_MASK_NOZONECHECKS DS_WriteLog "-" "" $LogFile DS_WriteLog "I" "End of script (total errors: $($ExitCode))" $LogFile |
To execute the script, open a command window (as administrator) and execute the following:
powershell.exe -executionpolicy bypass -file C:\Scripts\Citrix_CVAD_Check_Connection_Workers.ps1
The verbose output looks like this:

You find similar output in the log file. If you did not change the default values, the exact path to the log file is: C:\Logs\Citrix_CVAD_Check_Connection_Workers.log.
In case of an error, the first character on each line changes from “S” (success) to “E” (error). Also, an e-mail is sent to the administrator(s) in case a server was not reachable. If this happens you want to secure the dump file as soon as possible as described in the following section.
In the script (in line 47), the names of the workers are parsed using a simple array.
|
1 |
$Servers = "Worker1","Worker2","Worker3","Worker4","Worker5" |
You can of course replace this array with a different method. For example, you can read the server names directly from an OU in Active Directory or you can add the server names to a text file and read the contents of this text file directly in the script. These additional methods exceed the goal of this article. In case you need some help creating the PowerShell code, please contact me directly using the contact form on this website.
2. Secure the dump file (*.DMP) for further analysis
Now that we know which server(s) crashed, we need to retrieve the dump file (*.DMP).
When a Windows system crashes (“blue screen”), a snapshot of the memory that was in use at the time of the crash is stored in a dump file. We need to analyze this memory to find the root cause.
By default in Windows Server 2016, Windows creates an “automatic memory dump”, which is a kernel memory dump. For more information on this type of memory dump, please see the Microsoft article Windows 8 and Windows Server 2012: Automatic Memory Dump.
Which type of dump file is created at the time of a crash depends on how you configured your system.The type of memory dump file can be configured under Control Panel \ System \ Advanced system settings \ Advanced (tab) \ Startup and Recovery settings.

The size of the dump file depends on a couple of factors, but it can grow quite large (as large as the total available RAM in your system).
By default, a system crash is always followed by a system reboot. You can prevent this automatic reboot by clearing the tick box Automatically restart (see previous screenshot). Normally, you do not want to prevent the reboot, because it means that the system is not able to “repair” itself. If an automatic reboot is prevented, the administrator will have to reboot the system manually.
On a non-persistent machine, by default, all write IO is temporary. This includes such things as event logs and dump files. As soon as the machine reboots, all newly created files and folders that were created after the machine was last started will be deleted. After a reboot, a non-persistent machine will boot from the clean base image.
Therefore, on a non-persistent machine, you want to make some files and folders persistent. You do this by redirecting these files and folders to a locally attached persistent disk.
In the following paragraph I will show you how to redirect the dump files to a different location on a persistent drive. You can do this using Group Policy Preferences (GPP).
Redirect the dump file to a persistent disk
By default, dump files are stored in the following directories:
- C:\Windows\MEMORY.DMP -> full dumps
- C:\Windows\Minidump -> mini dumps
These locations are defined in the registry key HKLM\SYSTEM\CurrentControlSet\Control\CrashControl.

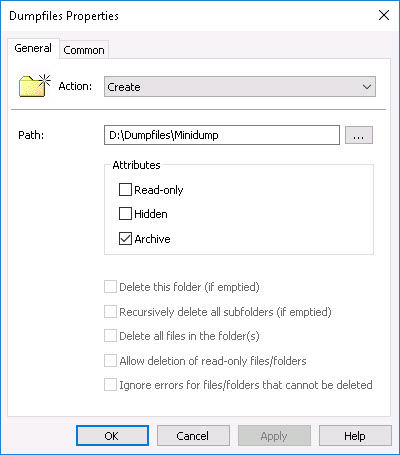
To redirect dump files you first need to create a directory on the persistent drive. In this article I will assume that this is drive D: (but this can be any drive letter of your choosing). We can use a GPP folder item to accomplish this.

Enter the full path of the folders you would like to create. In the example below, the path D:\Dumpfiles\Minidump creates two directories at once: D:\Dumpfiles and D:\Dumpfiles\Minidump. The full dump files will be stored in D:\Dumpfiles and the mini dumps in D:\Dumpfiles\Minidump.
I recommend to use Item-Level Targeting (ILT) to run this GPP item only when the folder does not exist.

Now that we have created the new location for the dump files, we need to actually redirect the dump files to this new location.
We need to create two GPP registry items; one to redirect the full dump files and one for the mini dump files.

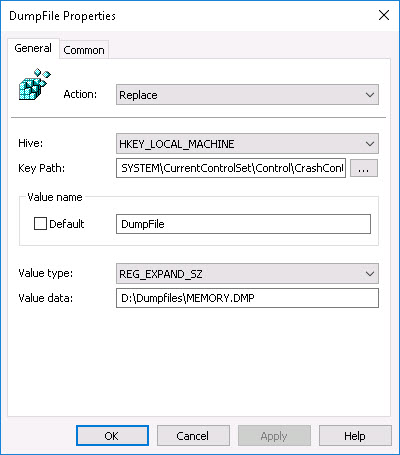
Let us first create the registry item for the main dump file:
- Action: Replace
- Hive: HKEY_LOCAL_MACHINE
- Key path: HKLM\SYSTEM\CurrentControlSet\Control\CrashControl
- Value name: DumpFile
- Value Type: REG_EXPAND_SZ
- Value Data*: D:\Dumpfiles\MEMORY.DMP
*Enter the directory of your choosing in the field value data.
Use ITL to make sure the target directory exists before redirecting the dump file.

Now we can create the second GPP registry item to redirect the mini dump file.
- Action: Replace
- Hive: HKEY_LOCAL_MACHINE
- Key path: HKLM\SYSTEM\CurrentControlSet\Control\CrashControl
- Value name: MinidumpDir
- Value Type: REG_EXPAND_SZ
- Value Data*: D:\Dumpfiles\Minidump
*Enter the directory of your choosing in the field value data.

Use ITL to make sure the target directory exists before redirecting the mini dump file.

And now we are done. As soon as the above group policy settings are applied to the servers the (mini) dump files will be redirected to the persistent drive.
In the following section I explain how to analyze a dump file and how to find the root cause of the server crashes.
3. Download and use Windows Debugger to analyze the dump file and to find the root cause of the server crashes
In the previous two sections we make sure that we are alerted when a server crashes, that we know the name of the server that crashed and that our dump files are stored persistently (not lost on reboot) so we can use them to analyze the root cause of the server crash. Now it is time to start analyzing a dump file.
I recommend that you copy the dump file to your local machine, assuming you are using a laptop or desktop and that you have administrative rights on this machine. I recommend this because;
- You will need to download and install Windows Debugger (WinDbg):
- You need administrative privileges to do this;
- You may need this application more times, so you do not want to install it on a non-persistent machine (worker);
- You do not want to install Windows Debugger on your normal workers that are used by your users.
- You need an internet connection to download the so-called symbol files. As an administrator, you may not always have an internet connection (read: proxy settings) on a server (worker).
Download, install and configure Windows Debugger (WinDbg)
You can download the Windows Debugger (WinDbg) for Windows 10 here:
https://developer.microsoft.com/en-us/windows/downloads/windows-sdk/
You can either download the installer (around 1,5 MB) or the complete ISO file (more than 800 MB). To install the debugging tools (including WinDbg) you only need to select Debugging Tools for Windows (requires about 436 MB). You can deselect all other features.

After the debugging tools have been installed you can start WinDbg. You can start the application by simply typing windbg in the Windows search box. If you used the default installation path, windbg.exe is located here:
C:\Program Files (x86)\Windows Kits\10\Debuggers\x64
Replace x64 with x86 for the 32-bit version of the debugging tools.
The first thing to do after installing and launching WinDbg is to define the path to the symbol files. Symbol files have the extension PDB and contain information that can be helpful when debugging dump files, such as function names and variables. Symbol files help you to better interpret the data displayed in WinDbg.
In the menu, go to File, Symbol File Path.

Enter the path to the Microsoft public symbol server:
srv*C:\TEMP\Symbols*https://msdl.microsoft.com/download/symbols

The green section, “C:\TEMP\Symbols”, represents the local directory where the downloaded symbol files are cached. Make sure to create this directory on your local computer. You can choose your own preferred directory path.
I also recommend to save the base workspace (File, Save Workspace). If you do not save the workspace, the symbol search path you entered will be lost as soon as you close the application. You will have to enter the path again next time you use WinDbg.
For more information on workspaces within WinDbg, see the following articles:
- Microsoft blog Using Workspaces (in WinDbg)
- Microsoft Creating and Opening a Workspace (in WinDbg)
Open and analyze the dump file
Now that we have prepared WinDbg we can open the dump file and start our analysis.
In the menu go to File, Open Crash Dump, select your *.DMP file and open it. You can choose to open the mini dump file or the larger, standard, dump file. I analyzed the larger one. My dump file was almost 1 GB in size.

Now comes the hard part. Dump files are not easy to analyze. I am not going to pretend that I am an expert in analyzing dump files. So far I have always been able to extract the information I need from them and I will share with you what I know.
The screenshot below is what you see when you open a crash dump.

The last section is a short bug-check analysis and already showed me an important piece of information: BugCheck 76.You can find references to all bug check codes in Microsoft’s Bug Check Code Reference. In this case, bug-check 76 relates to a driver that failed to release locked pages after an I/O operation.

This was interesting information, but it still did not tell me the root cause of this bug.
The main command you will use when using WinDbg is !Analyze -v. This command displays detailed information about the current exception or bug check. The parameter -v shows verbose output. You can either enter this command at the bottom of the tool in the KD command line…
![]()
…or you can simply click the !Analyze -v link in the section Bugcheck Analysis.
Now we will see a lot more detailed information that will (hopefully) help us to find the root cause.

Some process of driver is making my servers crash. The most important piece of information that led me to the root cause was the process name.

The process name is one of the first things that you should check. The executable mentioned here is most likely the root cause of your system crash.
In my case, the process name was not displayed fully. I do not know why; perhaps the maximum length that can be displayed is limited at 14 characters. The full name of the process “software_repor” was “software_report_tool.exe” and is part of Google Chrome’s Cleanup Tool.
In all honestly, I still had a bit of a challenge to find the full process name. I searched the local machine for any file starting with “software_repor”, but did not find any. This confused me a lot. The reason why I could not find the file was that the file is stored in the user’s AppData\Local folder, here to be exact:
C:\Users\%UserName%\AppData\Local\Google\Chrome\User Data\SwReporter
This tool is automatically downloaded by Chrome. Not all users had this file in their AppData\Local folder. On the machine where I was checking non of the users had this tool in their profile yet, so I was not able to find it. In the section Software Reporting Tool in the article Google Chrome on Citrix deep-dive I explain how you can prevent the Software Reporter Tool from running.
And that was it for me. I found my root cause and did not have to dive further into the dump file. In case a driver is the main cause for your servers crashing, you may have to further investigate the dump file. If this is the case, please consult the following two sections in the article WinDBG – The Basics for Debugging Crash Dumps in Windows 10:
I hope this article was of some help to you.
Dennis Span works as a Principal Account Technology Strategist at Cloud Software Group in Vienna, Austria. He holds multiple Citrix certifications (CCE-V). Dennis has been a Citrix Technology Advocate (CTA) since 2017 (+ one year as Citrix Technology Professional, CTP). Besides his interest in virtualization technologies and blogging, he loves spending time with his family as well as snowboarding, playing basketball, and rowing. He is fluent in Dutch, English, German, and Slovak and speaks some Spanish.

I think the reg keys above should be HKLM\SYSTEM\CurrentControlSet\Control\CrashControl
You are absolutely right John! Thanks for the feedback. I have corrected the registry entries.
Thanks Dennis for sharing this knowledge.
You are welcome Chatrughan!
Great article. It absolutely helps in setting up the location for crash dumps on a persistent disk. Attaching a D drive (for example) in PVS target machines is easier but how to do it in MCS? As far as I know, MCS will not capture any drive other than C while creating the snapshot of the golden image.
Hi Nishith,
Thanks for your kind words. As to your question, it is true that MCS only captures the C: drive, but also when using PVS only the C: drive is streamed. The persistent write cache disk is only created when deploying the target devices using the PVS console. The same applies to MCS, at least from Citrix CVAD/XenDesktop version 7.9 (and higher). Since version 7.9, MCS offers MCS I/O (caching in RAM with overflow to disk), which creates a write cache disk similar to PVS. There is one other way how to create a persistent write-cache disk, which is to add an additional disk to the virtual machine (either manually in your hypervisor console or by using PowerShell).
Thanks for replying to my comment, Dennis.
I wanted to go for adding additional disk to the VMs using script because the cache disk that MCSIO creates cannot be initialized hence cannot be accessed. After doing some more research I found one article CTX226095 that suggests quite a good solution. Instructions are to create a new application layer and attach the secondary disk to that layer. Then change the location of pagefile to that disk in the application layer that you just created rather than doing it in the OS layer.
Luckily my client uses App Layering 🙂
Hope you already know that in CVAD 1903, the MCSIO cache disk can be accessed which resolves all the problems.
Again, I appreciate your efforts in replying to my comment.
You are welcome Nishith. I am happy you found a way how to proceed. And yes, you are right, from CVAD 1903, MCSIO is basically implemented the same way as the PVS write-cache disk.
This is really kind of you to give us this type of information. Thank you very much, Dennis
You are very welcome Ray. Happy to help!
is it normal for the dedicateddumpfile.sys to be on the PVS cache drive when moving the dump locations to a D drive?
Hi Ray, I do not remember seeing the actual *.sys file on the PVS cache disk. Did you follow the instructions in the article? You should only change the “CrashControl” registry values.
Pingback: EUC Weekly Digest – January 19, 2019 – Carl Stalhood